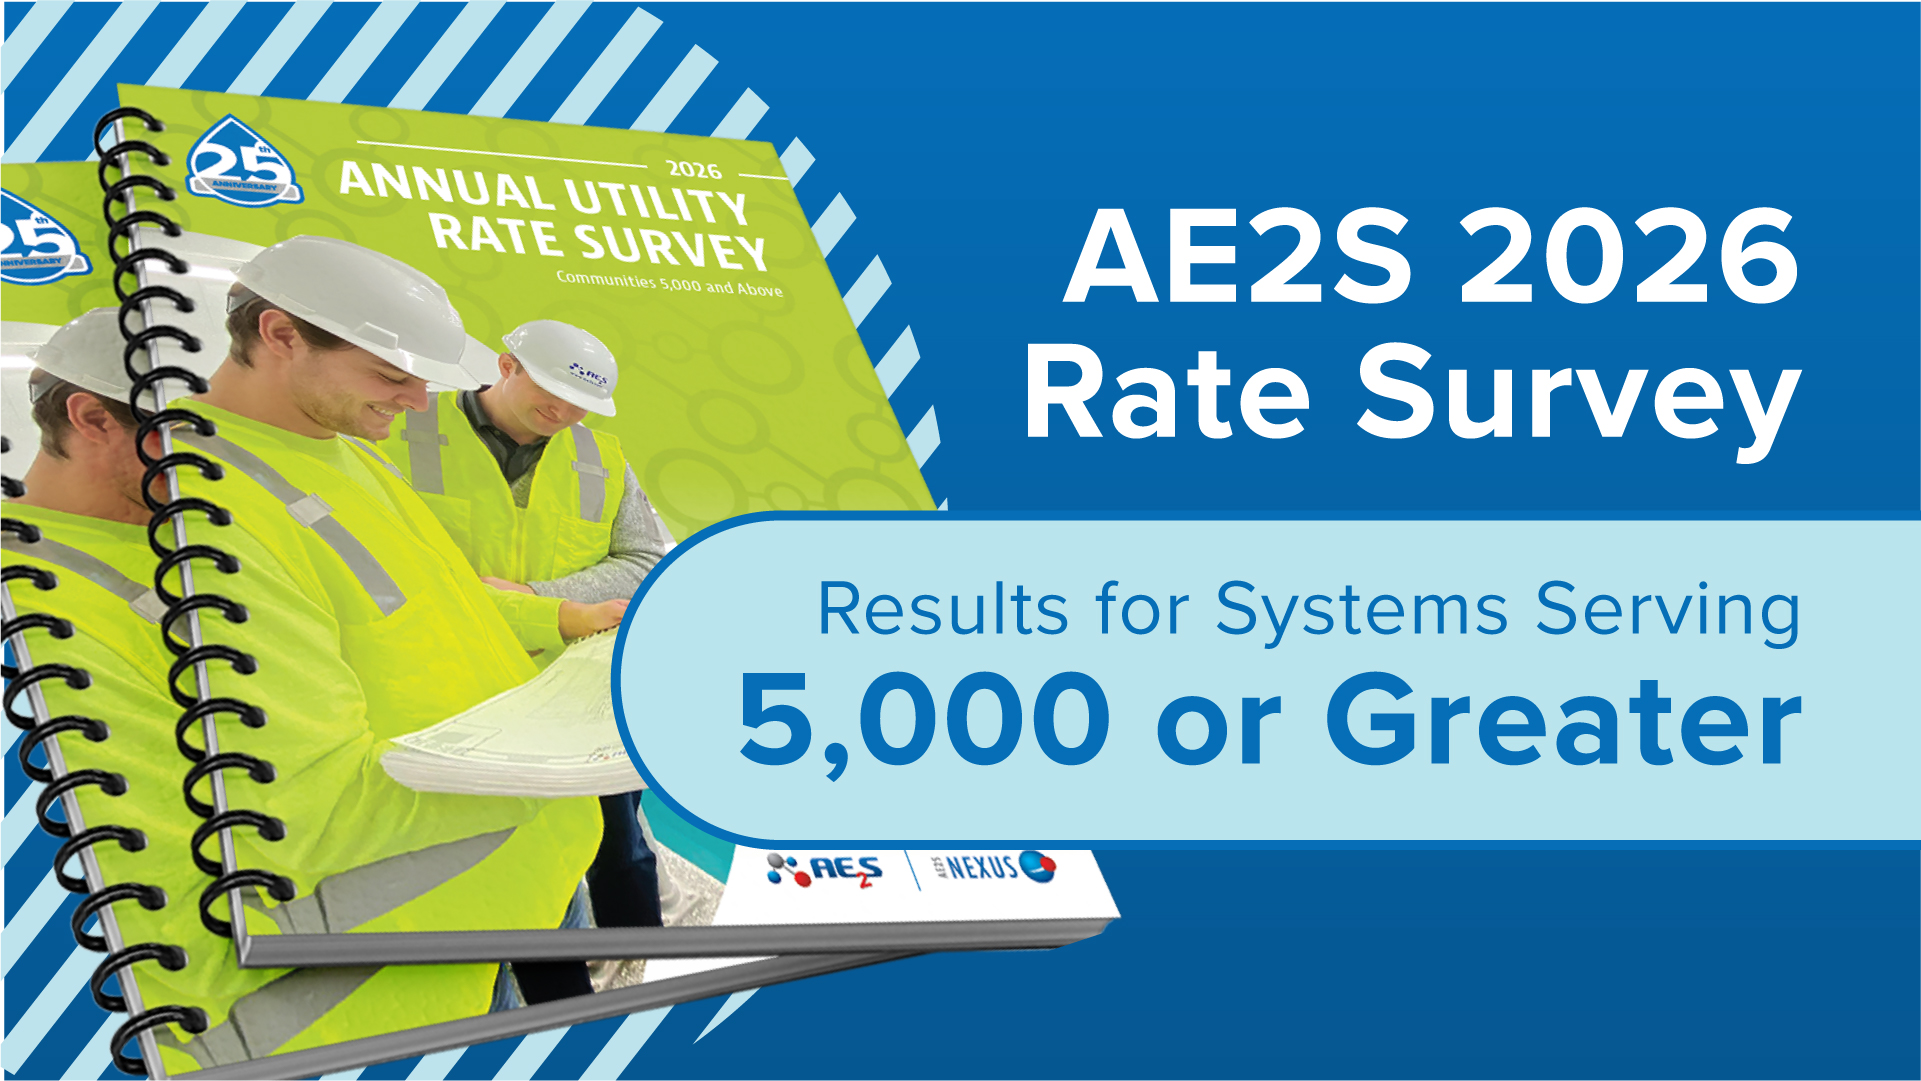
Distribution of the 25th Edition of the AE2S Nexus Annual Utility Rate Survey is underway! Here is a preliminary look at the results to help you understand how your rates compare to those of your peers. Results can be useful to systems as budgets are finalized and 2027 rates are set, by providing a regional measure for utilities to benchmark themselves against similar systems and/or the nearby systems.
2026 Combined Utility Rates
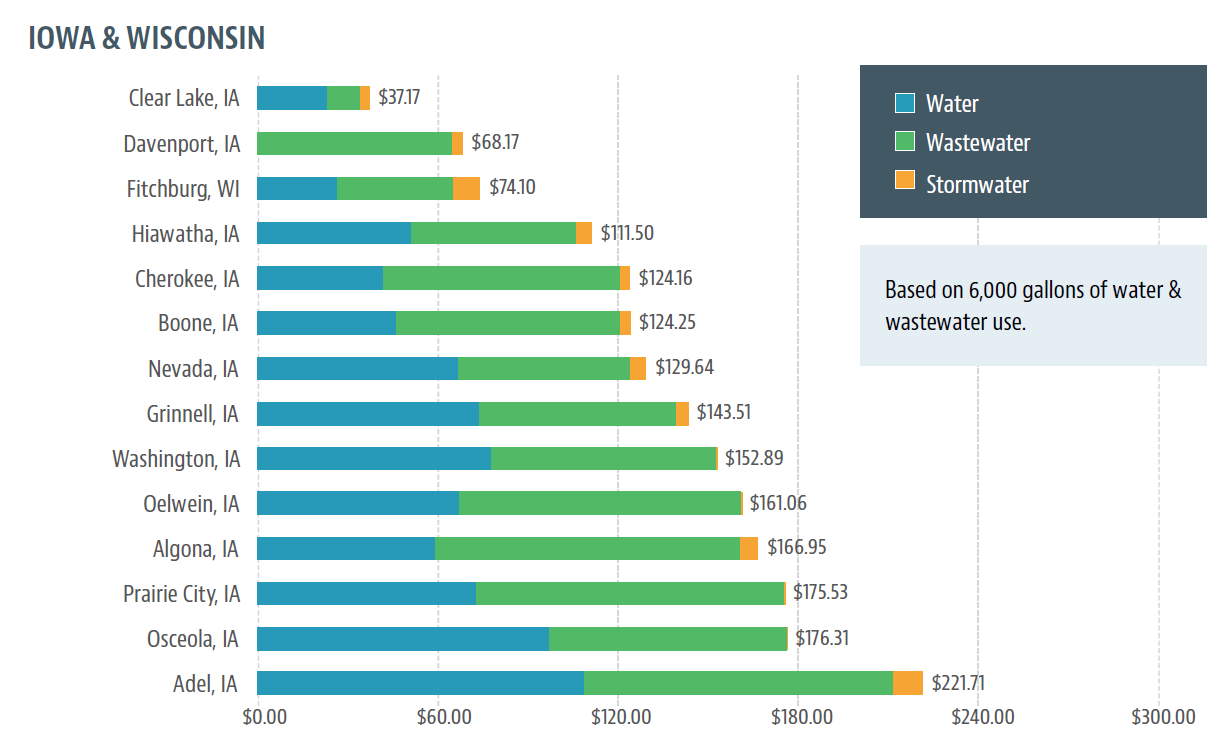
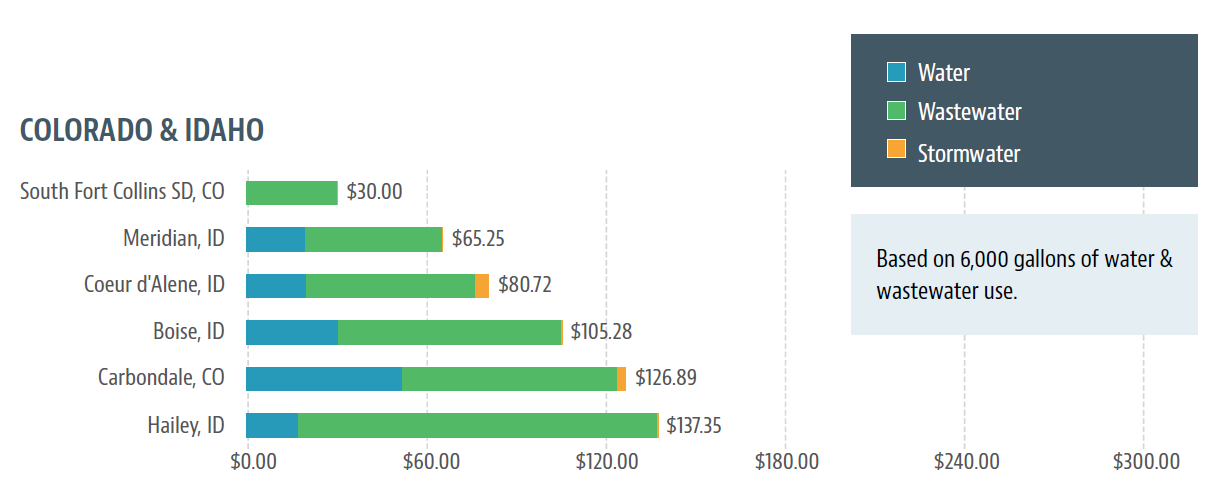
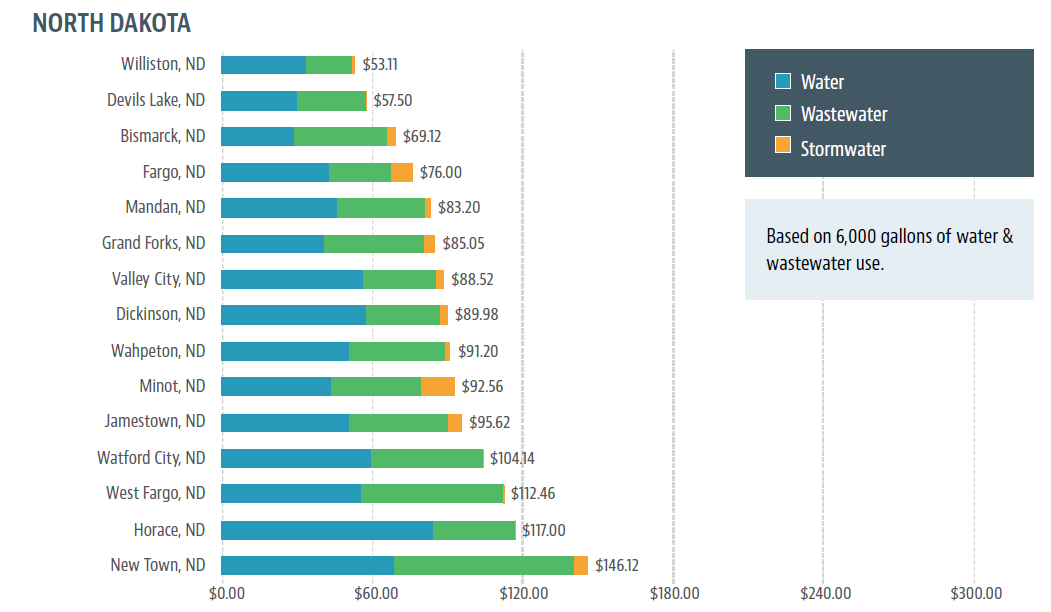
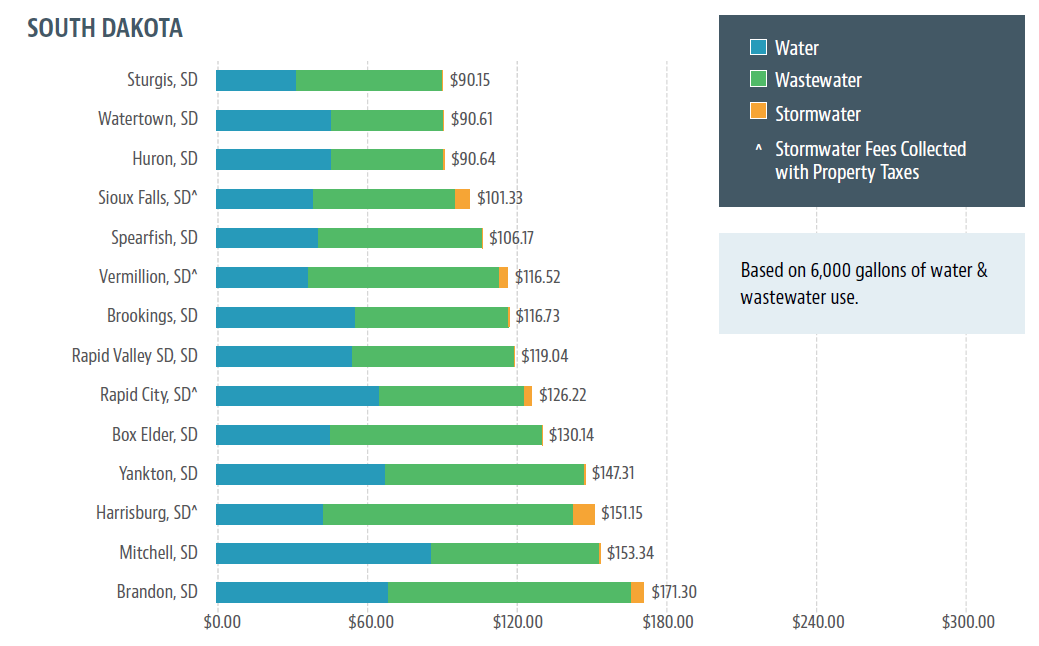
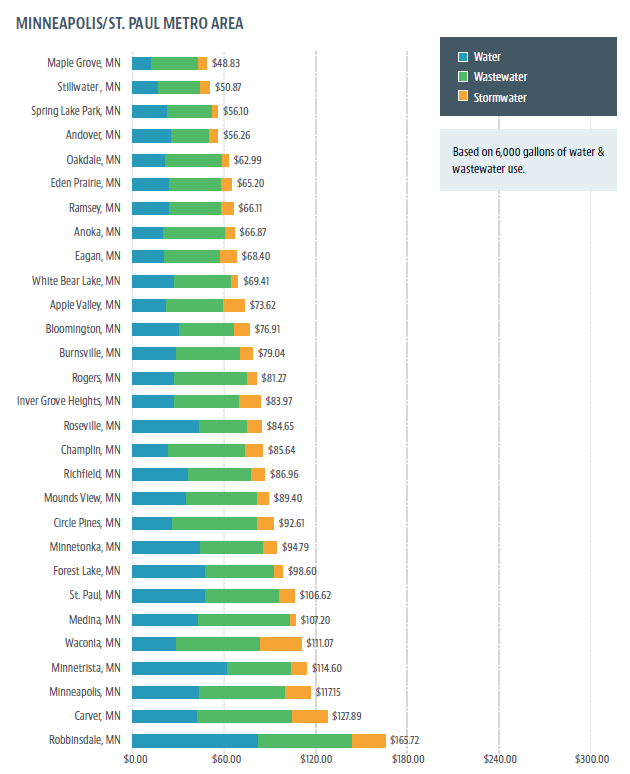
The Utility Rate Survey booklet contains charts of water, wastewater, and stormwater rates, as well as a Total Utility Bill that includes water, wastewater, and stormwater. Because each community faces different challenges, it is often useful to look at the combined utility rate when comparing the cost of utility service between communities. The values reported in the following tables illustrate the reported 2026 monthly residential charge for a utility bill equating to 6,000 gallons of water and corresponding wastewater usage, as well as a stormwater charge, when applicable.
Figures 1 through 9 represent the reported results for communities serving greater than 5,000 people by State. Figure 9 illustrates the Total Utility Bill for Minnesota systems serving greater than 5,000 and provided wastewater service through the Metropolitan Council Environmental Services (MCES) in the Minneapolis/St. Paul metro area.
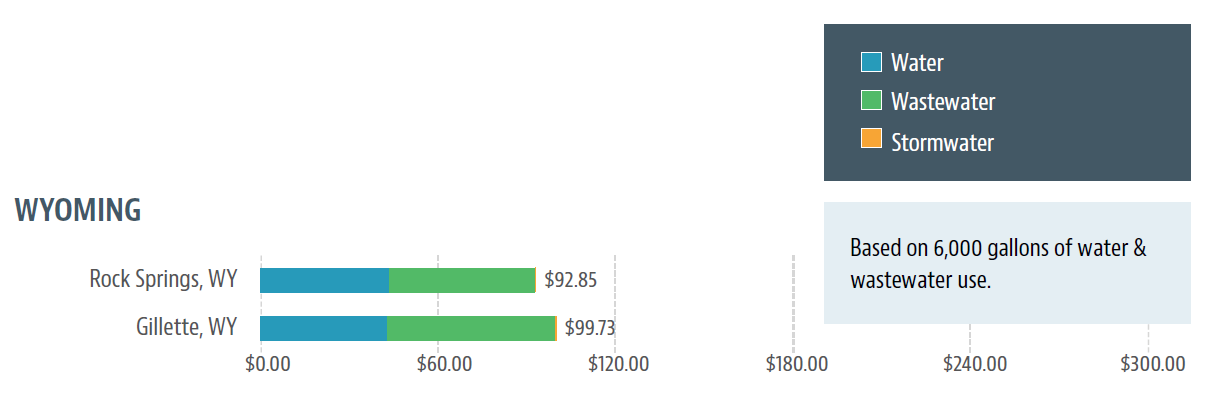
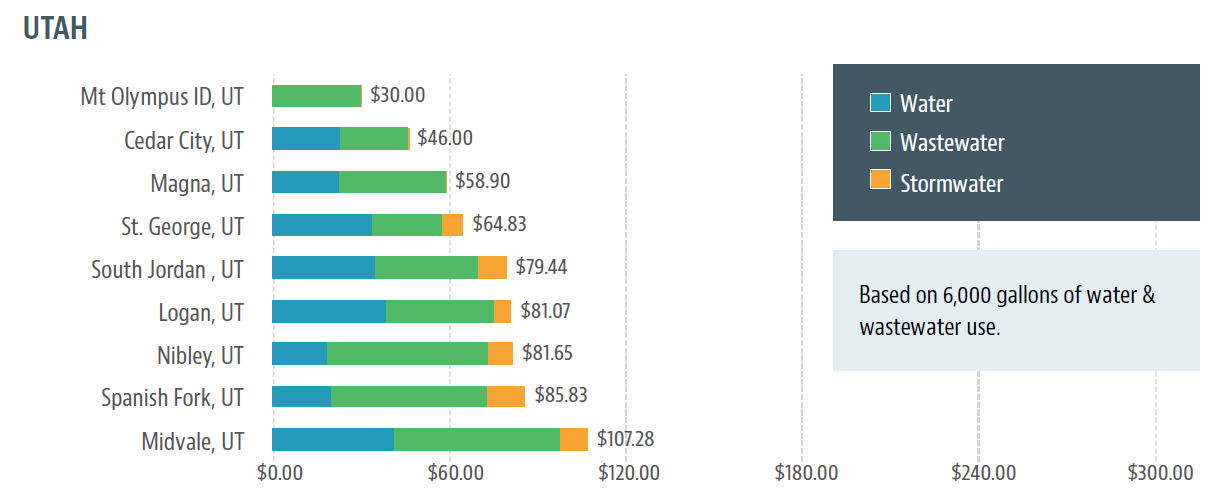
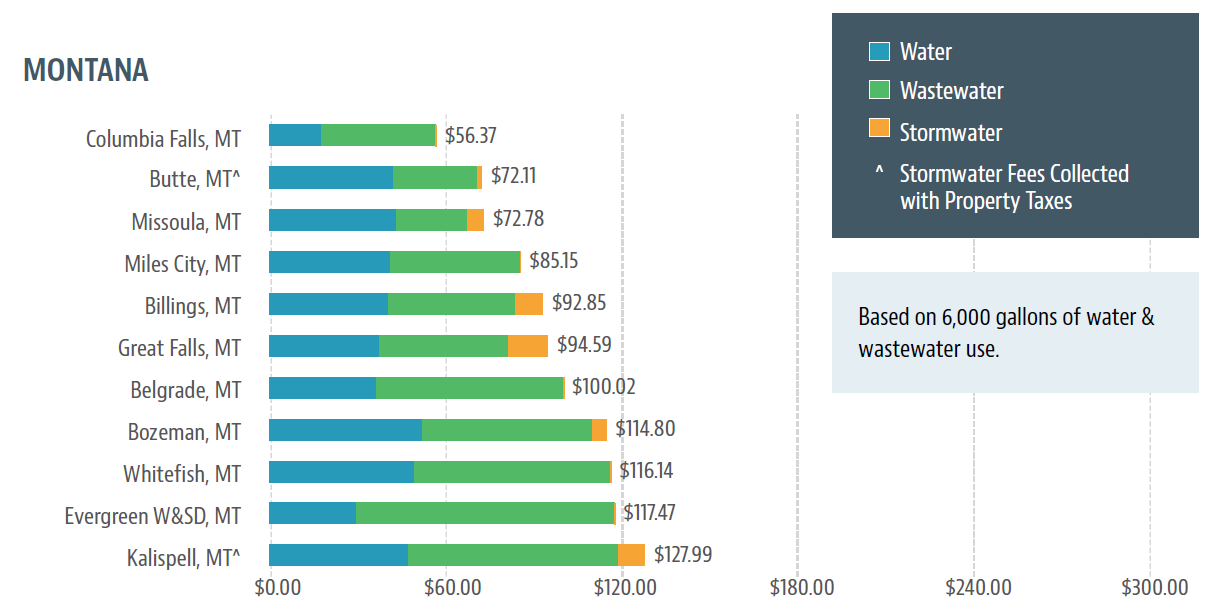
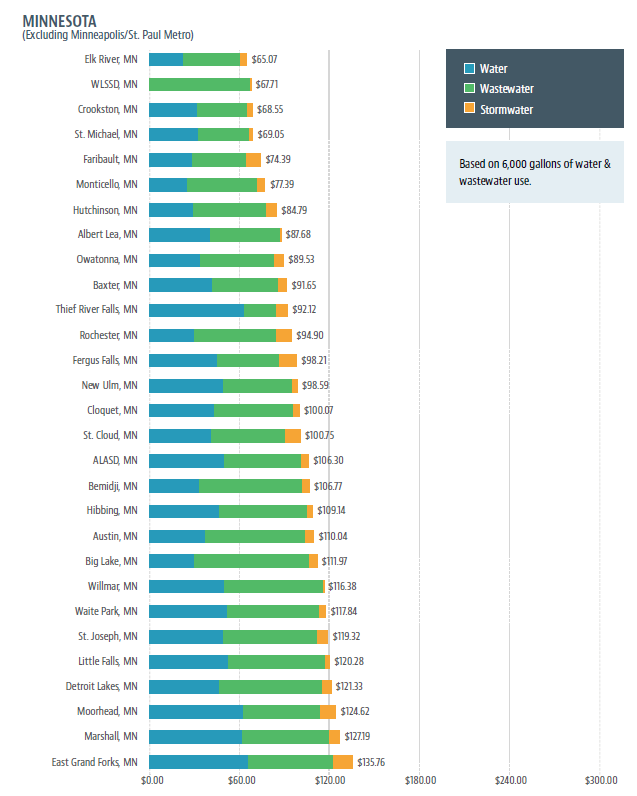
In total, AE2S Nexus received survey responses from 129 systems serving 5,000 or more. Substantial efforts were taken to report accurate data. Although verification efforts were completed where possible, in some instances data may not have been provided in full or fully verified. We hope you find the survey results useful. If you have any questions related to the 2026 Annual Utility Rate Survey, please contact Miranda Kleven at 701-746-8087 or Miranda.Kleven@AE2S.com.