
A Quick-View Guide to Turning Rate Data into Better Decisions
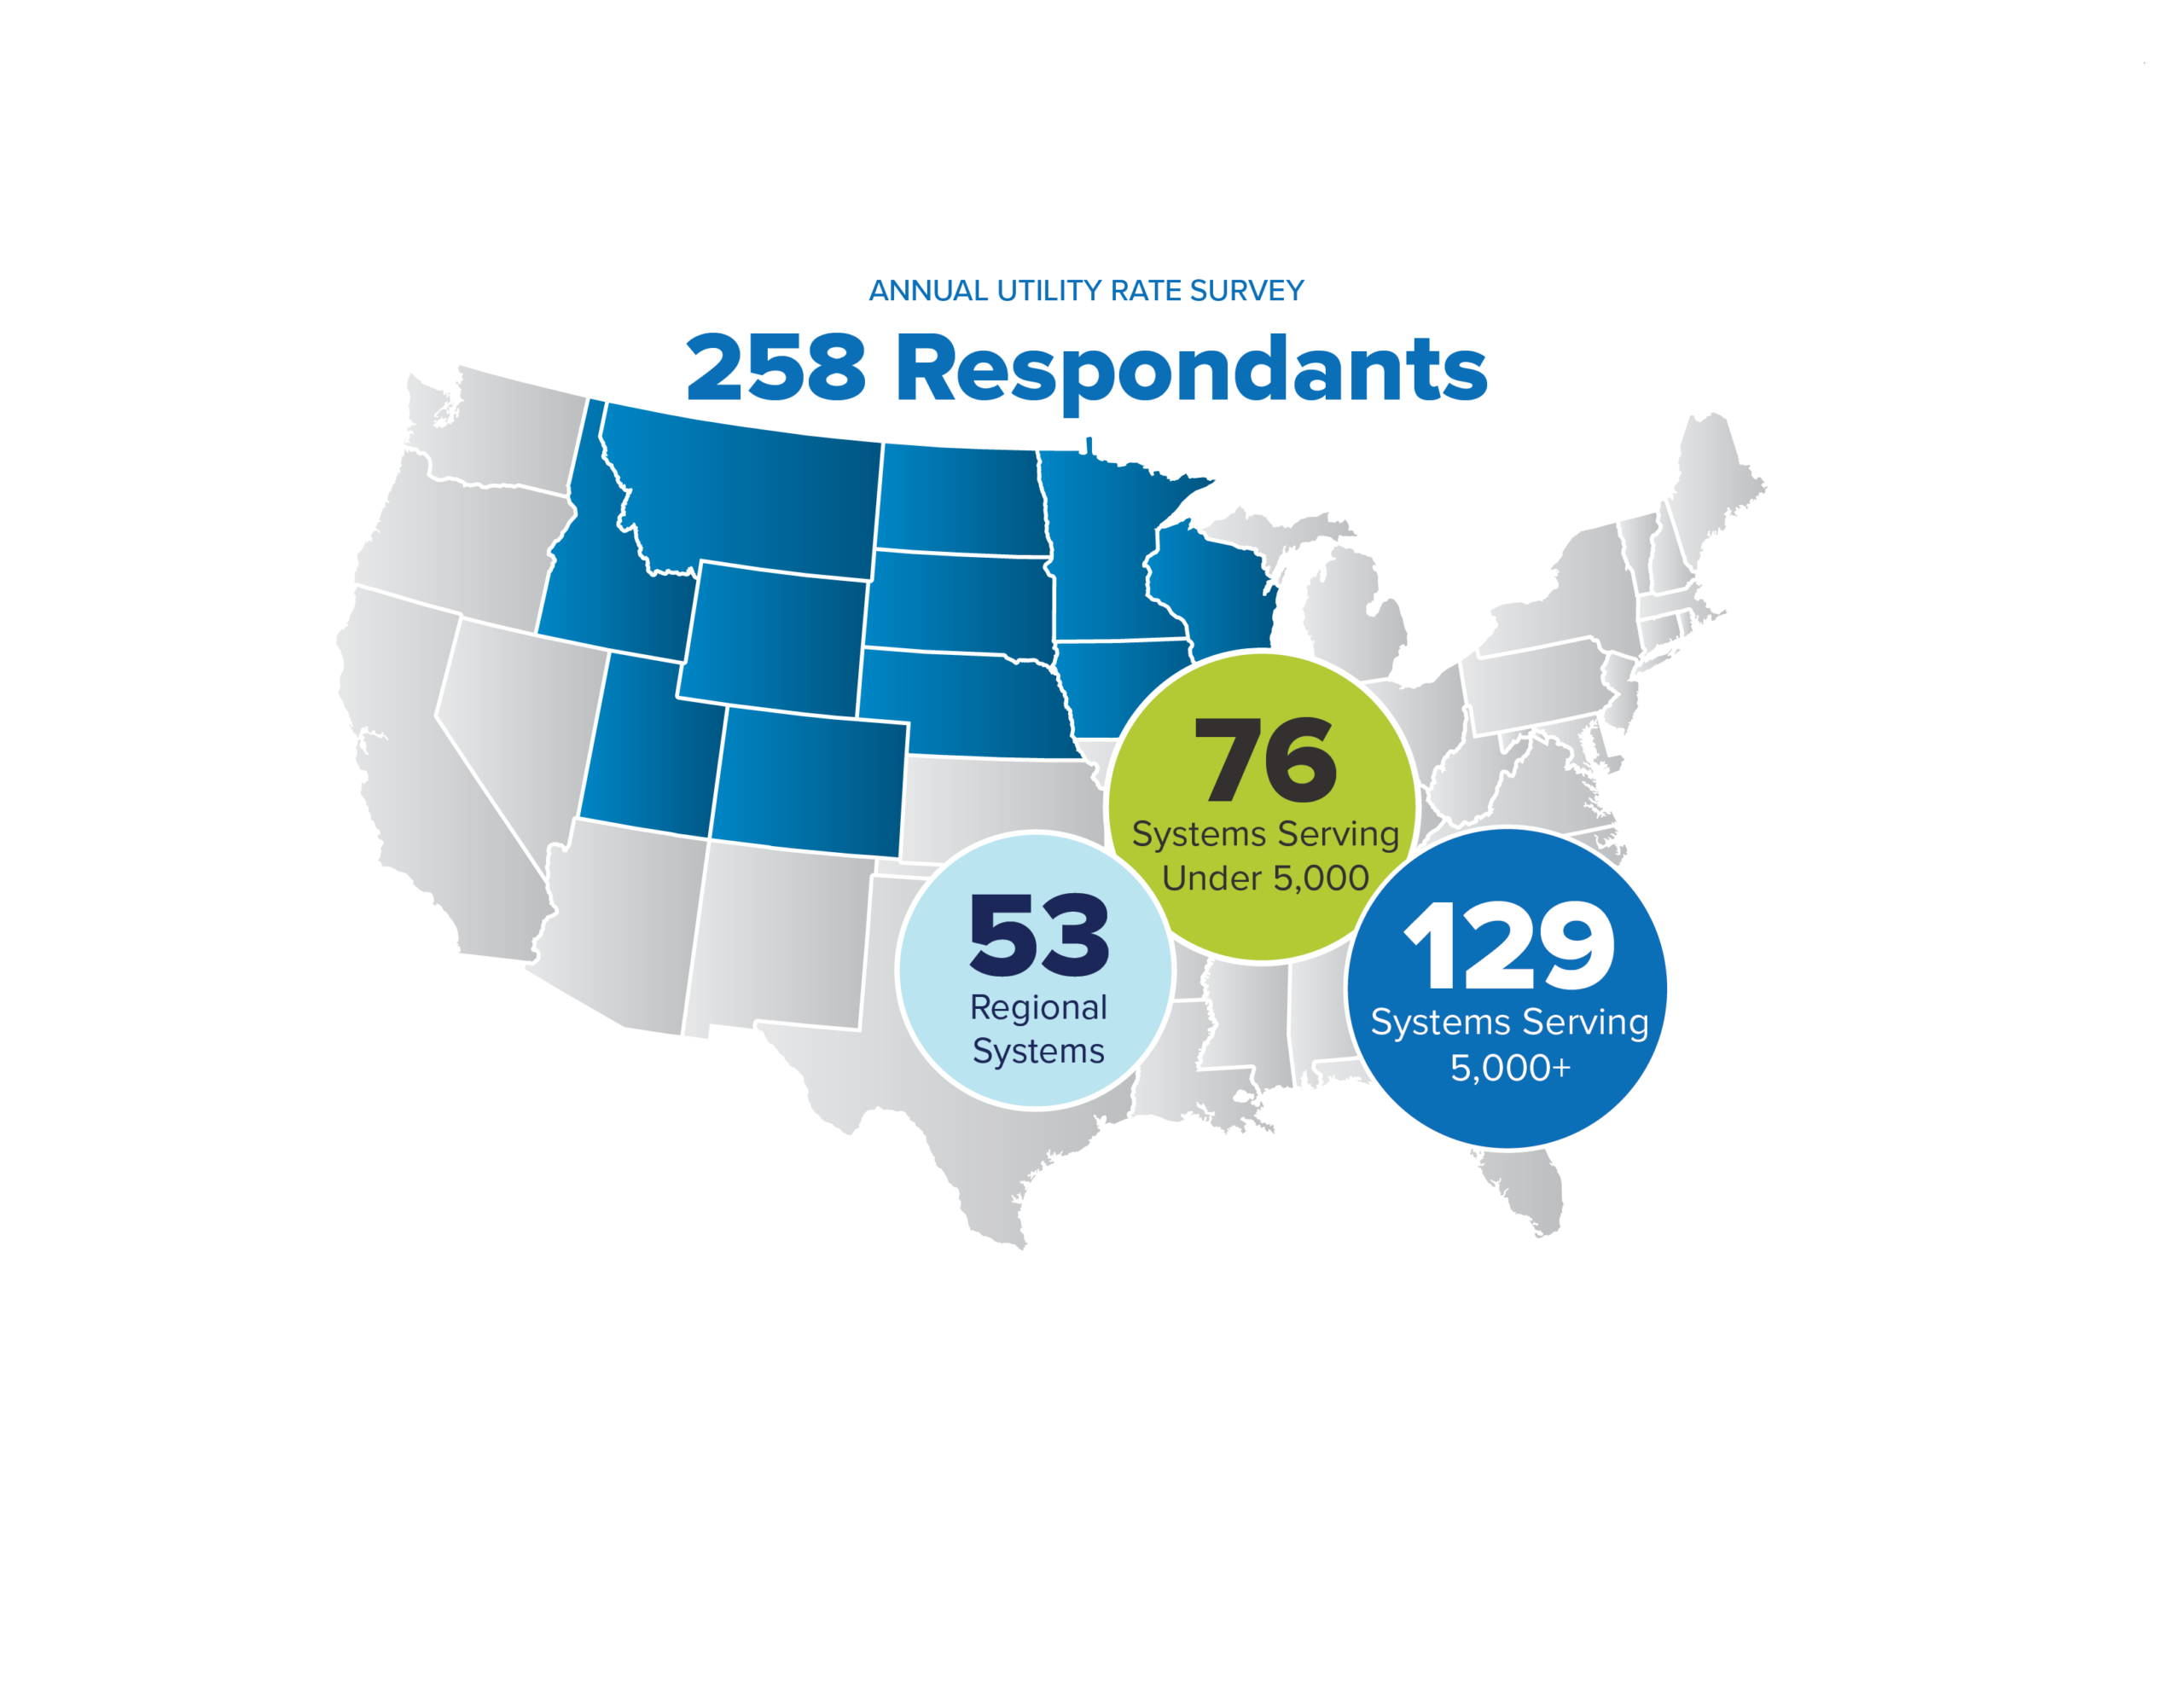
The 2026 Annual Utility Rate Survey booklets are being delivered in person and via mail. AE2S Nexus received responses from 129 systems serving populations 5,000 and greater, 76 systems serving populations less than 5,000, and 53 Regional Rural systems. Survey data was solicited from utilities in Colorado, Idaho, Iowa, Minnesota, Montana, North Dakota, South Dakota, Utah, Wisconsin, and Wyoming.
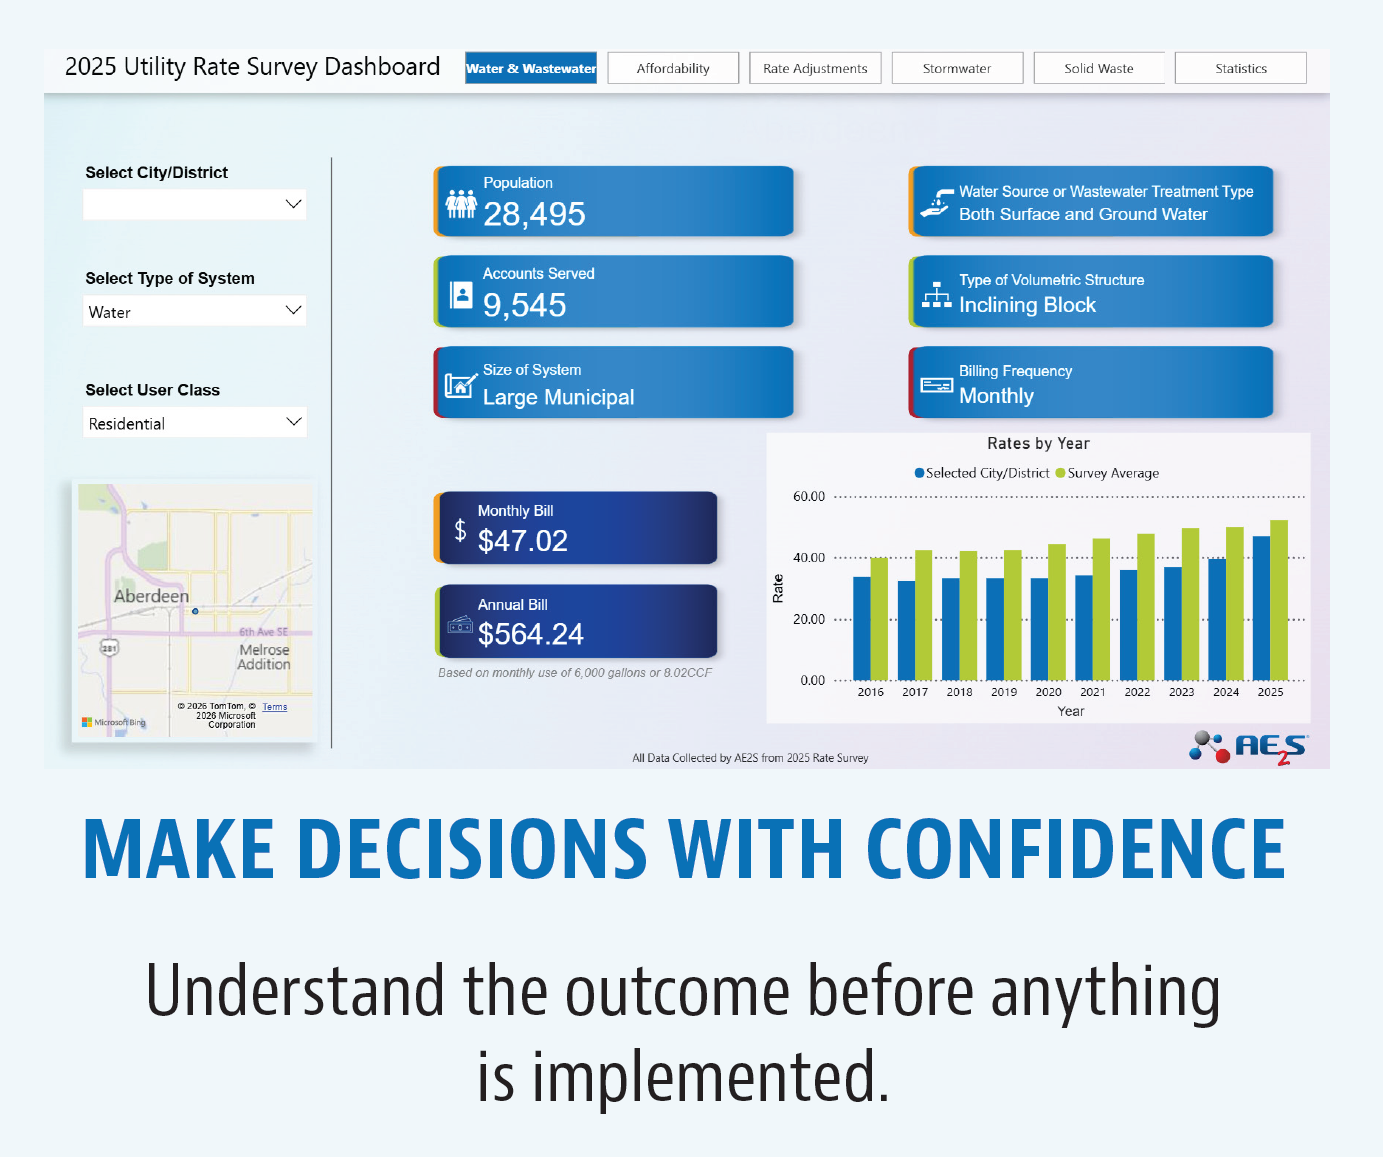
To enhance the usefulness of the Annual Utility Rate Survey, we offer an online Dashboard for use by participants. The dashboard can be accessed by logging into the site at: ae2sratesurvey.com. Rate survey participants can either login using an existing account or create a new account by following the prompts at the bottom of the page.
Two survey reports have been prepared: one for systems serving 5,000 people or more, including systems in the Minneapolis/St. Paul metro area; and a second survey for systems that serve fewer than 5,000 people, as well as Regional Rural Water Systems. In appreciation for volunteering to provide survey information, each participant receives a hard copy of the complete report.
Make the Survey Work for You
Are you looking for ways to put this year’s AE2S Annual Utility Rate Survey to work? The survey can do much more than compare rates. It can help you benchmark your utility, anticipate future challenges, evaluate potential rate changes, and build stronger conversations around key decisions.
Here are five easy ways to get more out of this year’s data.
1. How Do You Compare?
One of the most common questions utility leaders hear is, “How do our rates compare to other communities?” The survey provides a quick and credible way to answer that question.
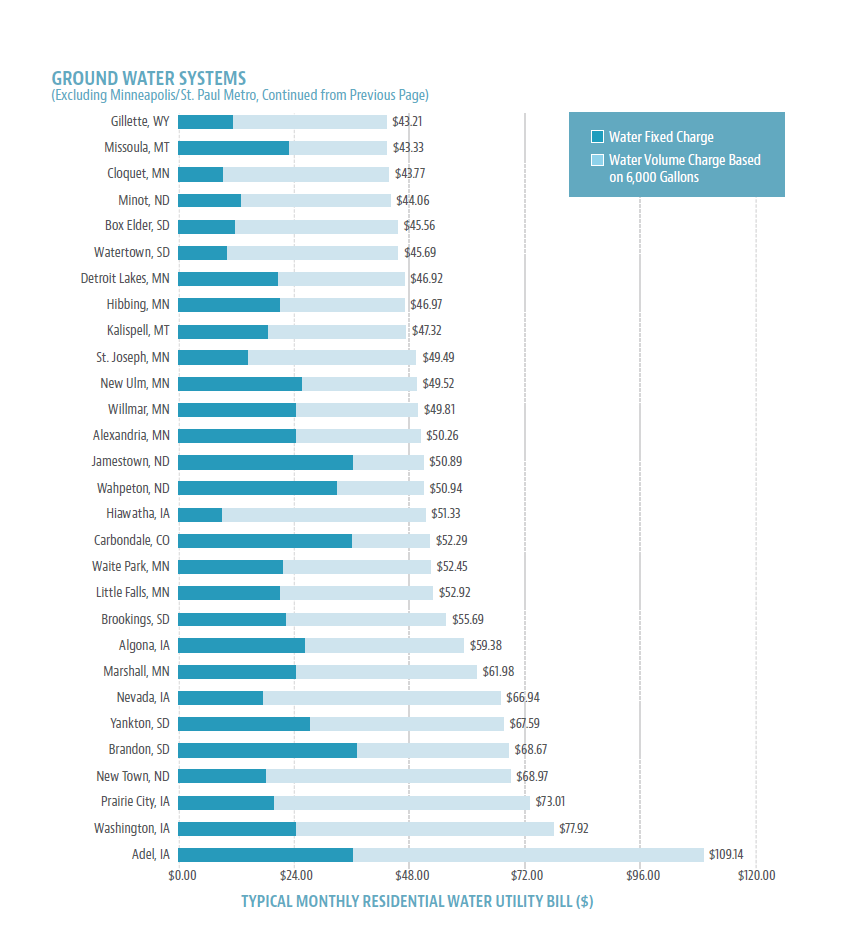
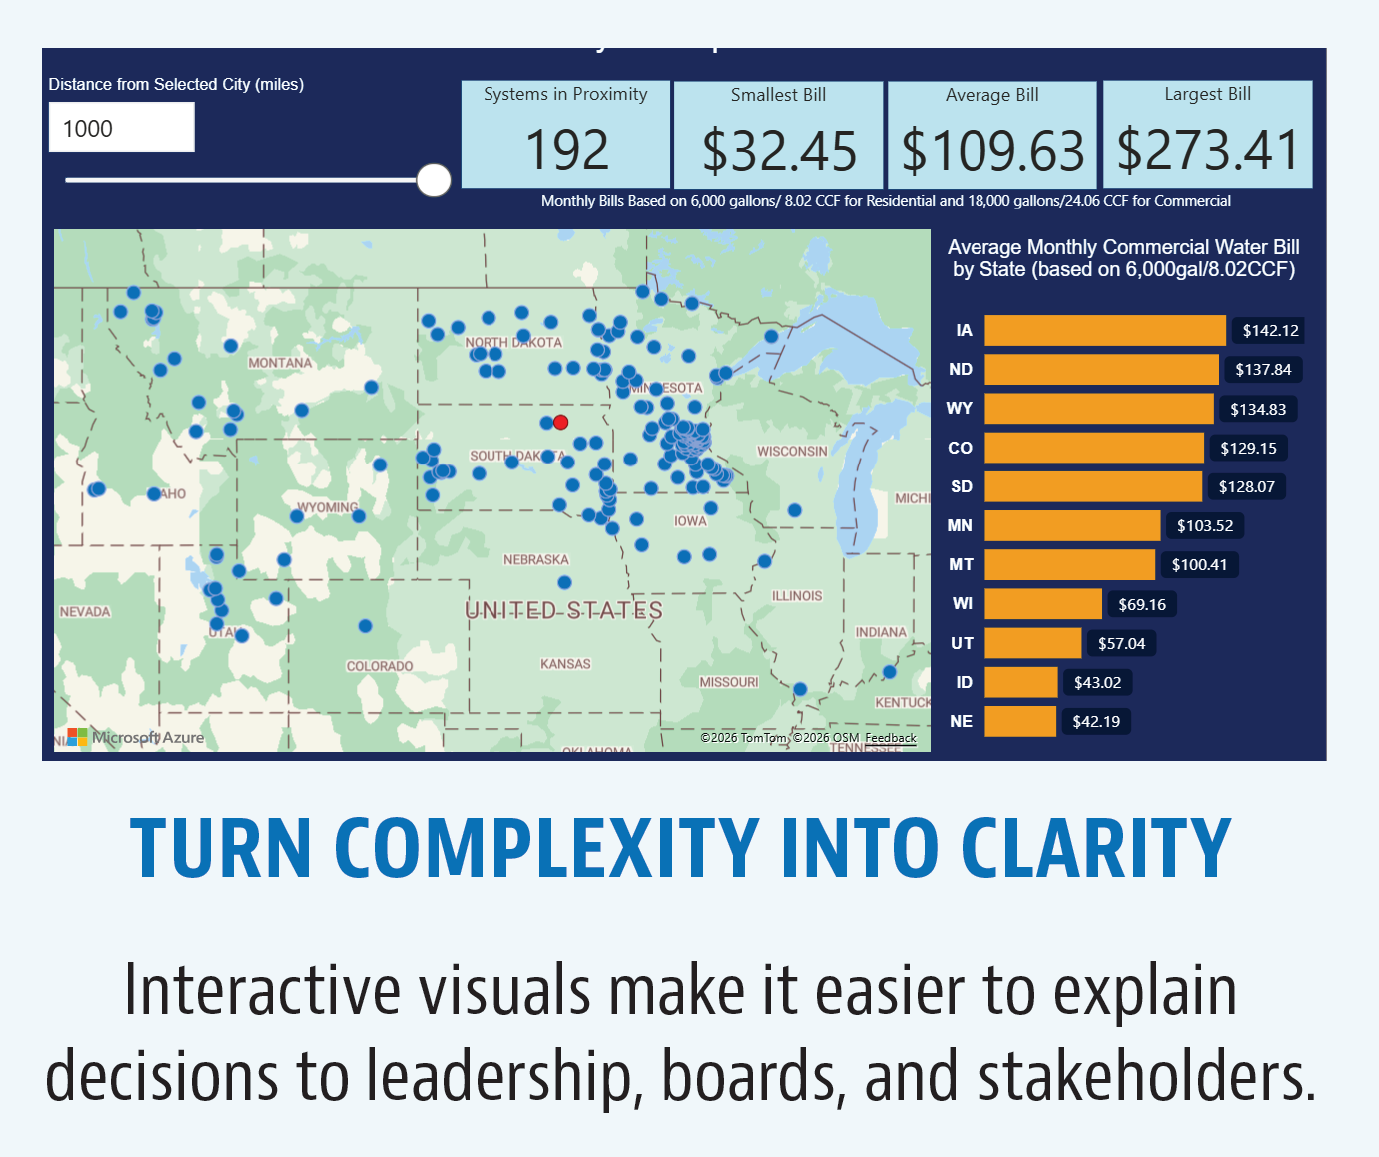
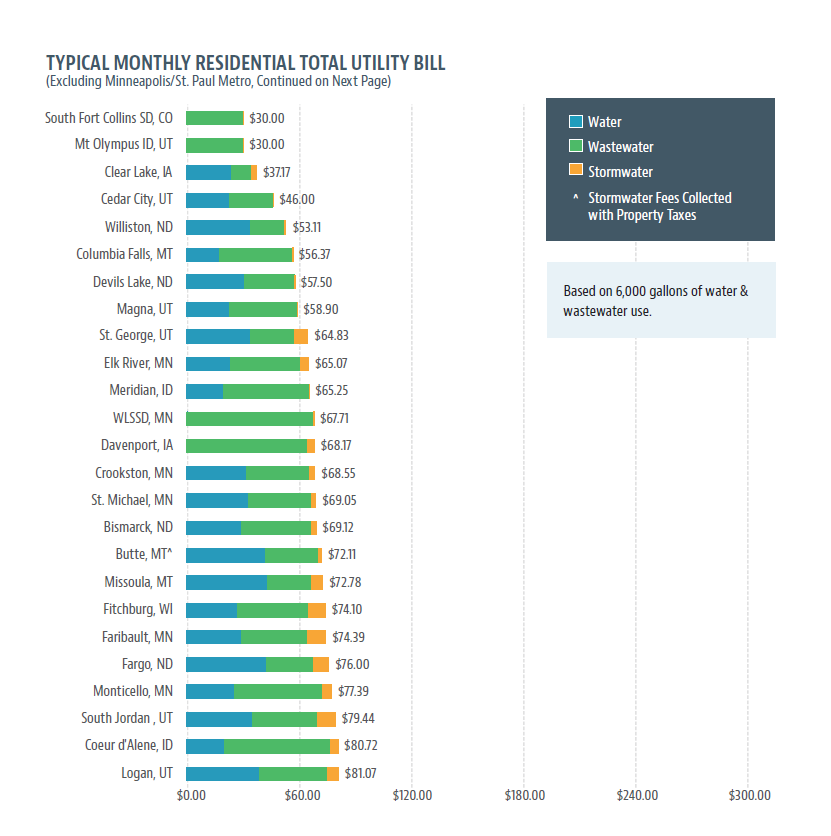
Use the regional comparisons and peer community data to see where your utility stands on total monthly bills as well as individual water, wastewater, and stormwater charges. Comparing yourself to neighboring communities can help provide context for discussions about affordability, competitiveness, and future rate adjustments.
Quick Tip: Include one or two survey charts in presentations to city councils, leadership teams, or advisory committees to instantly put your rates into perspective.
2. Take Out Your Crystal Ball
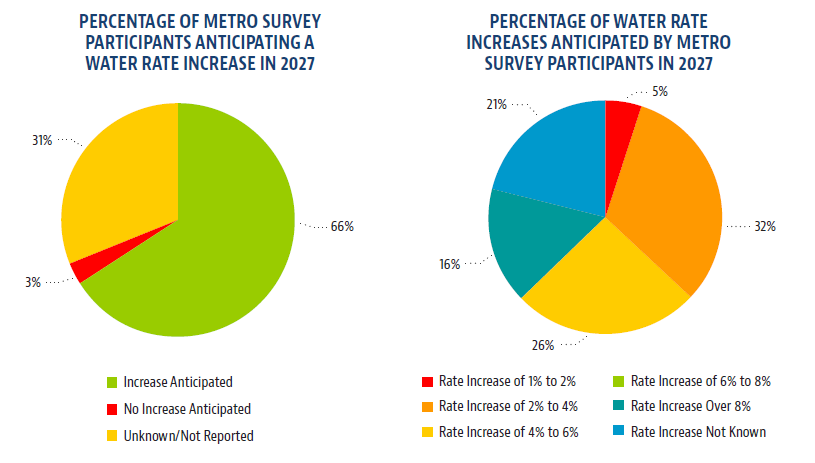
Rate discussions shouldn’t focus only on today’s numbers. The survey includes forecasted rate increase information that offers a glimpse of where communities are headed.
Review the back section of the survey to identify trends among communities facing similar challenges. Are neighboring cities planning major infrastructure investments? Are treatment costs increasing across your region? Understanding future pressures can help validate your own planning efforts and identify emerging trends before they become urgent issues.
Quick Tip: Use forecast data to support long-range financial planning and demonstrate that many communities are navigating similar challenges.
3. Trial Run a Rate Change
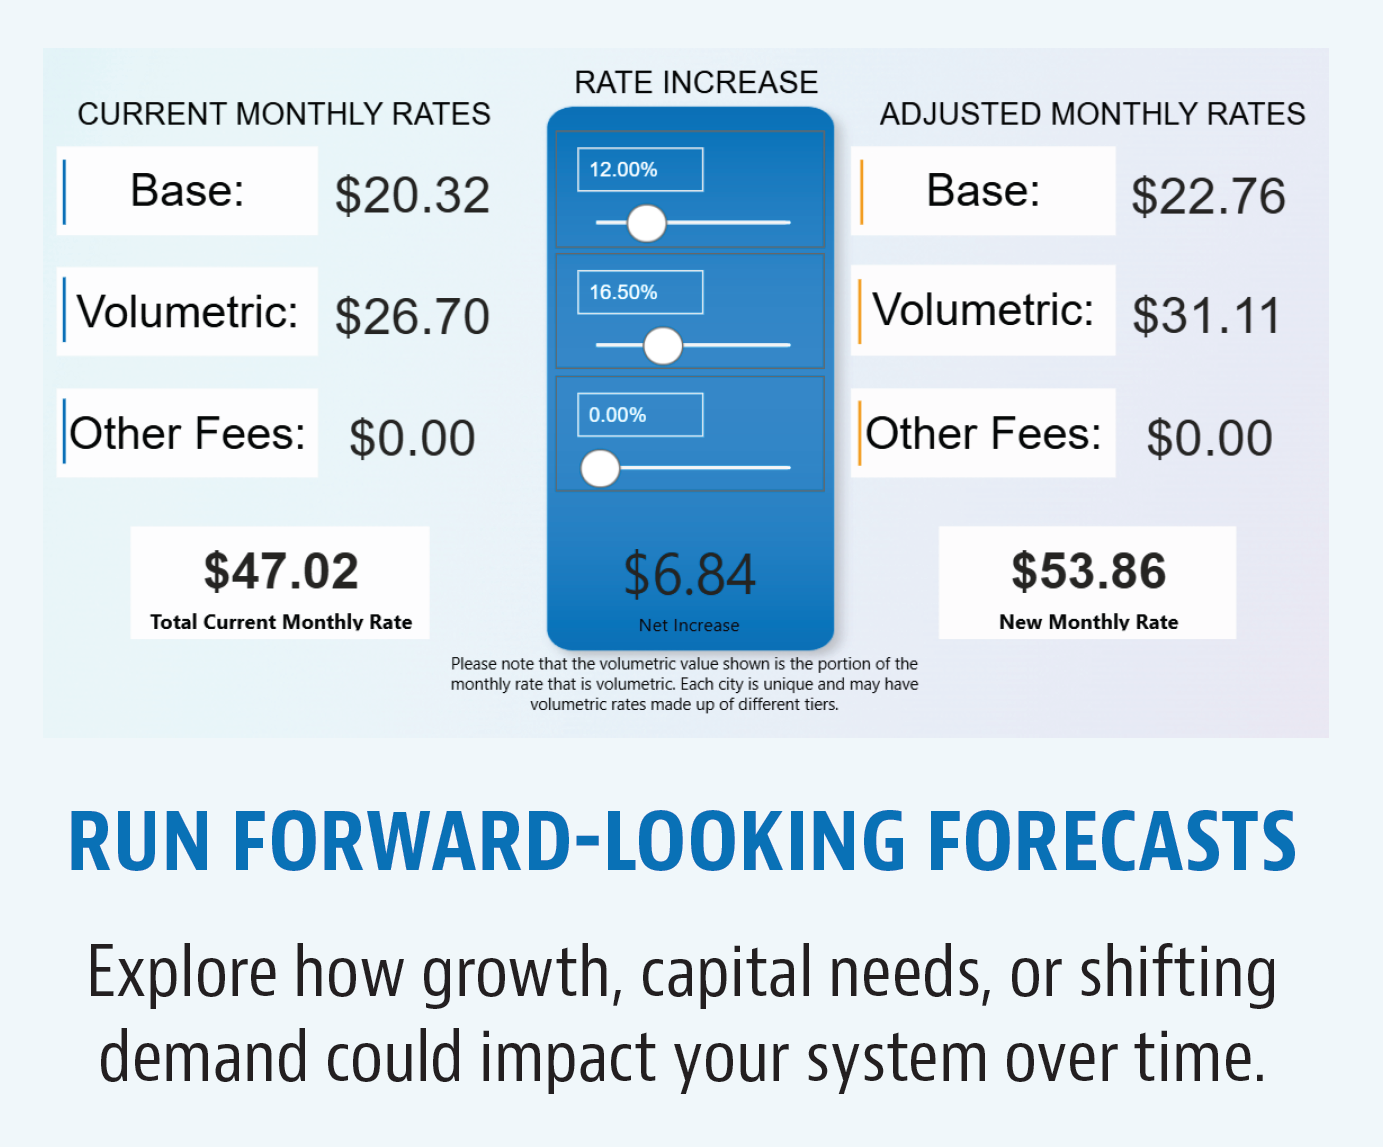
What happens if water rates increase by 3%? What if stormwater fees need to rise to support a capital improvement program?
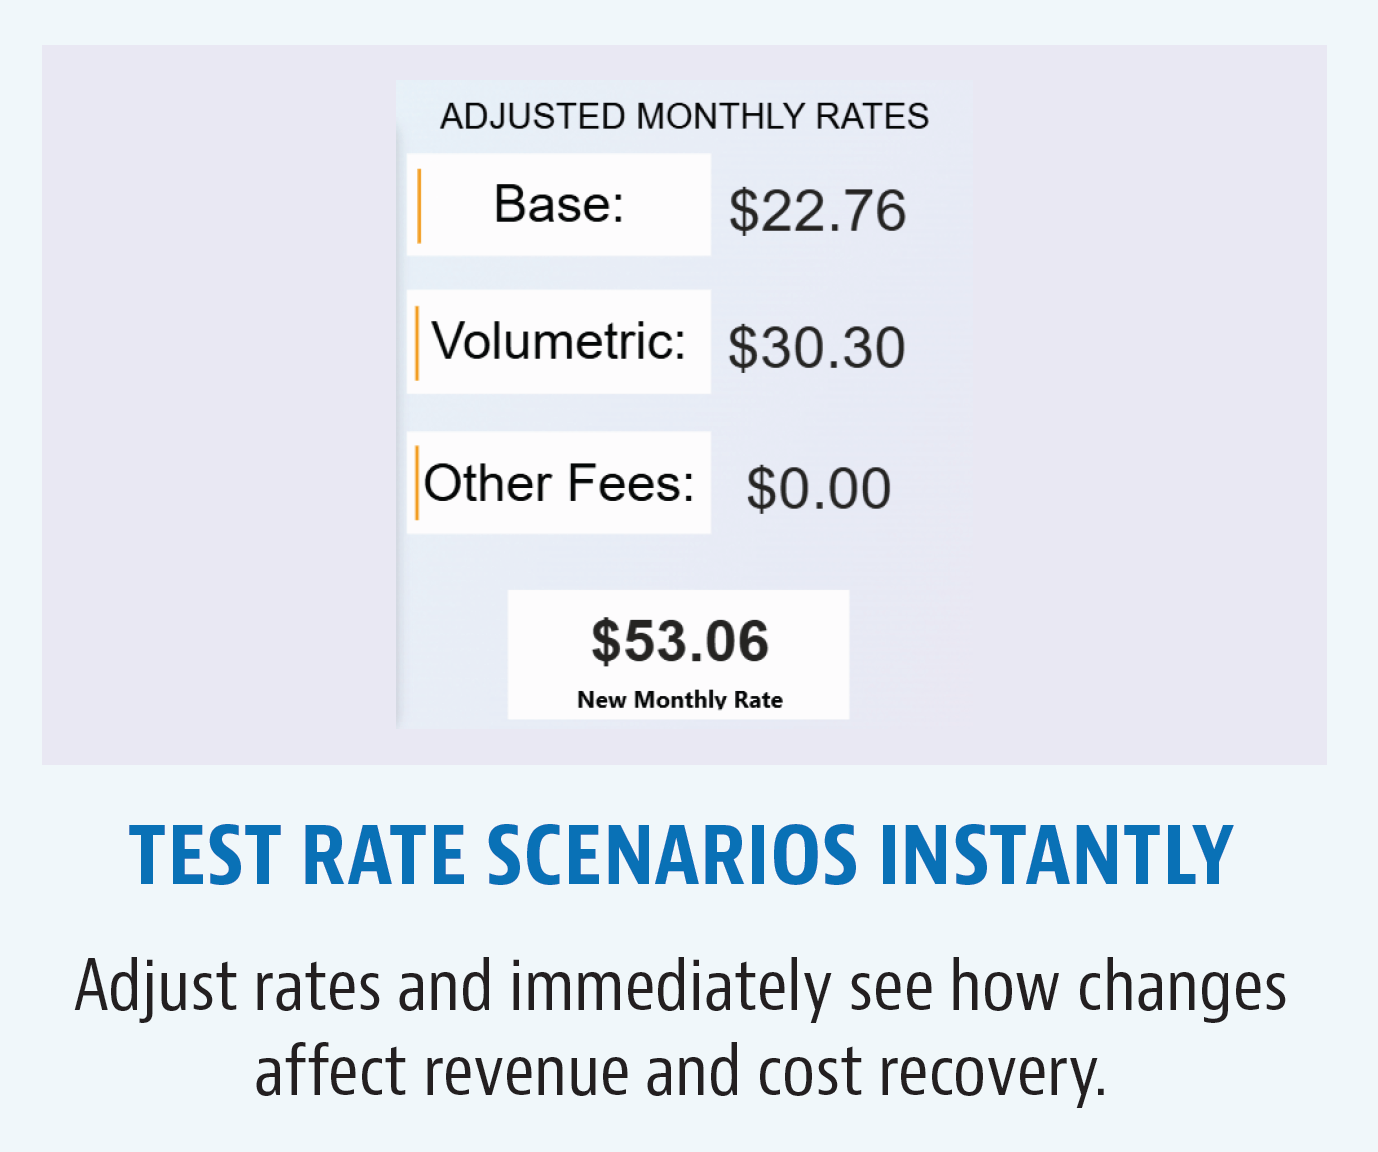
The survey’s digital dashboard allows users to test potential rate scenarios and immediately see how those changes affect customer bills. Instead of relying on rough estimates, decision makers can evaluate different options and understand their impacts before making a recommendation.
Quick Tip: Use the dashboard to compare multiple scenarios side-by-side and identify solutions that balance financial needs with customer impacts.
4. Take a Listen
The survey isn’t just about numbers. Each year, it captures a snapshot of the conversations happening across the utility industry. From large metropolitan systems to small rural communities, many of the same themes continue to emerge: aging infrastructure, funding challenges, regulatory requirements, workforce needs, and pressure to maintain reliable service while keeping rates affordable. Understanding these broader conversations can help utilities benchmark not only their rates, but also their challenges and priorities.
Quick Tip: Review the discussion trends section before strategic planning sessions to understand the issues other communities are wrestling with.
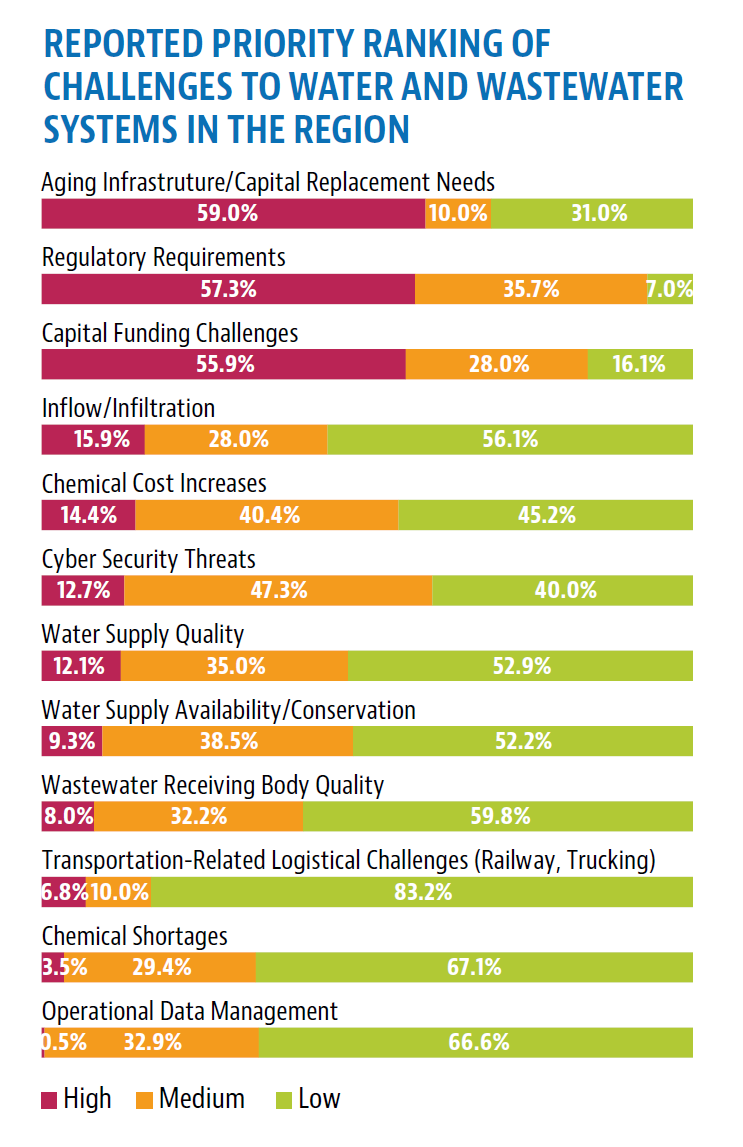
5. Getting Ready for Budget Conversations? Start Here.
Budget season often requires utilities to explain complex financial realities to elected officials, stakeholders, and customers. The survey provides data and visuals that can help support those conversations.
Combining rate comparisons, forecasted increases, and dashboard analysis can help demonstrate why long-term planning matters. The survey can also help decision makers see that local challenges are often part of larger industry trends, creating a stronger foundation for discussions about investments and future rate adjustments.
Quick Tip: Use survey charts and dashboard outputs to move conversations beyond opinion and toward data-driven decision making.
Need Help Making Sense of the Data?
Utility rates are about more than numbers. They affect customers, community priorities, infrastructure investments, and long-term financial sustainability.
AE2S Nexus can help utilities evaluate rate structures, analyze financial impacts, and develop strategies that support both operational needs and future growth.
AE2S Communications can help communities navigate stakeholder conversations, build public understanding, and engage residents and decision makers around complex utility topics.
Whether you are planning for the future, evaluating rate adjustments, or preparing for important community conversations, our teams are ready to help bridge the gap between data and decision-making. Reach out to Miranda Kleven, AE2S Nexus Senior Consultant, if you have questions about the Rate Survey.