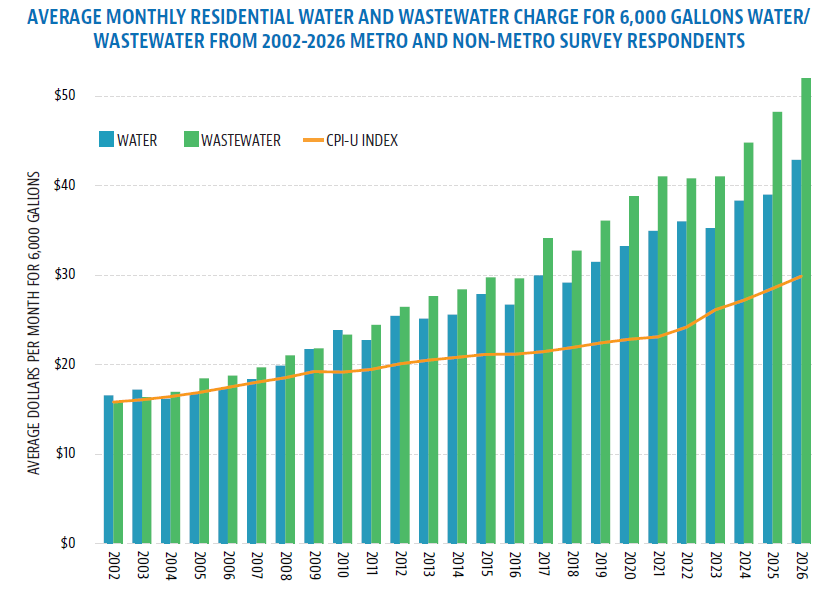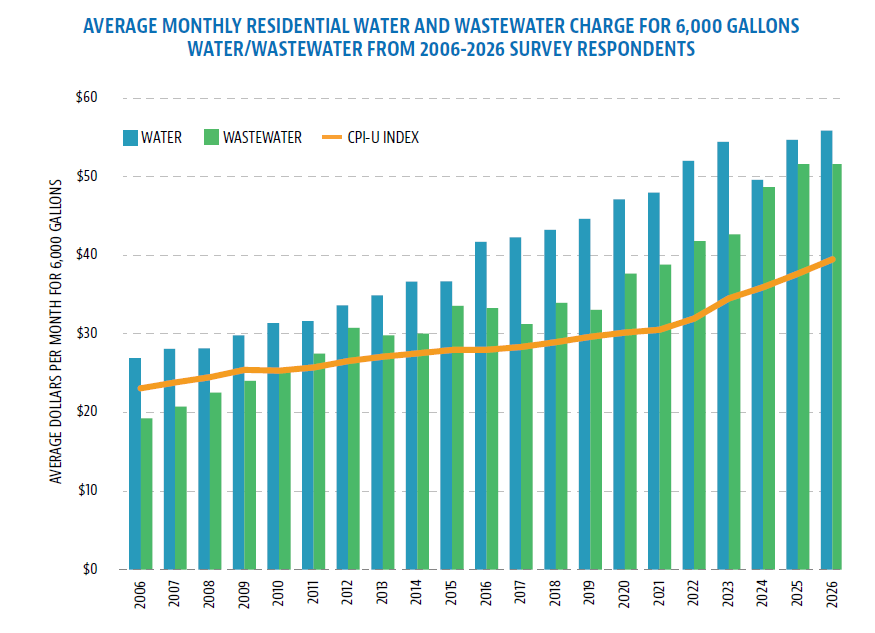
Inflation has been a hot topic recently. Although utility rates may not immediately come to mind, they have increased at a rate higher than historical inflation values. It’s true – the average water and wastewater charge for 6,000 gallons from 2002 to 2026 climbed at a higher rate based on the Consumer Price Index for All Urban Consumers (CPI-U).
No doubt many utility managers and policy makers will read this inflation statistic and see their own challenges reflected as they balance financial demands and rate increases. Here are some additional insights from the 2026 survey results.
Where Water Rates are Rising
Of the survey respondents serving greater than 5,000 people, 29 are among those in the Minneapolis/St. Paul metro area that receive wastewater services from the Metropolitan Council – Environmental Services. Results from Minneapolis/St. Paul metro area respondents indicate that 93% of the responding systems implemented an increase to water rates in 2026. For the same group, 97% of wastewater systems and 76% of stormwater systems increased rates in 2026.
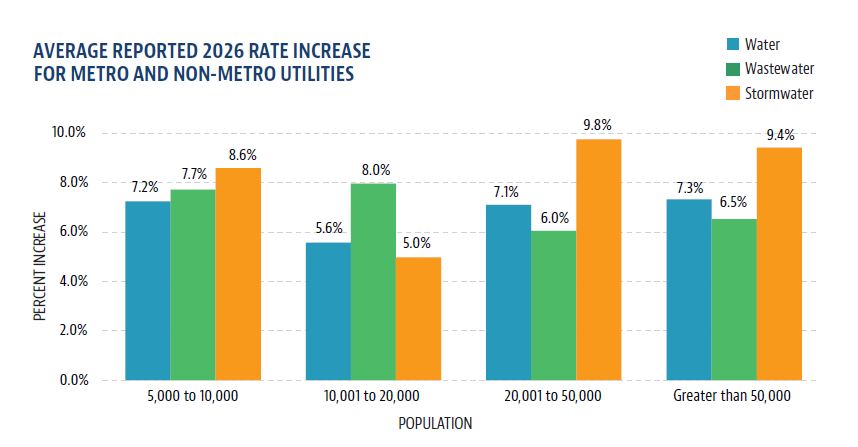
Beyond the Minneapolis metro area and across eight states, 75% of large systems respondents that serve populations greater than 5,000 people (labeled non-metro) reported water rate increases and 74% reported wastewater rate increases in 2026, while 50% of stormwater systems increased rates. The average percent increase for each utility by population is shown in Figure 1 for metro and non-metro systems serving 5,000 or more people.
Overall, the average increases in 2026 for water, wastewater, and stormwater systems serving 5,000 people or more were 6.8%, 7.1%, and 8.3%, respectively. For comparison, in 2025 the average rate increases for systems of this size were 7.5% for water, 6.6% for wastewater, and 11.7% for stormwater.
For systems serving fewer than 5,000 people, 62% of respondents reported an increase to water rates, 54% increased wastewater rates, while 26% also reported a stormwater rate increase in 2026. For the small systems that reported increases in 2026, Figure 2 illustrates the average increases by population. Among the systems serving fewer than 5,000 people, the average reported increases for 2026 were 6.2% for water, 6.9% for wastewater, and 11.9% for stormwater. Water, wastewater, and stormwater rate increases reported last year were 6.3%, 11.1% and 11.5%, respectively.
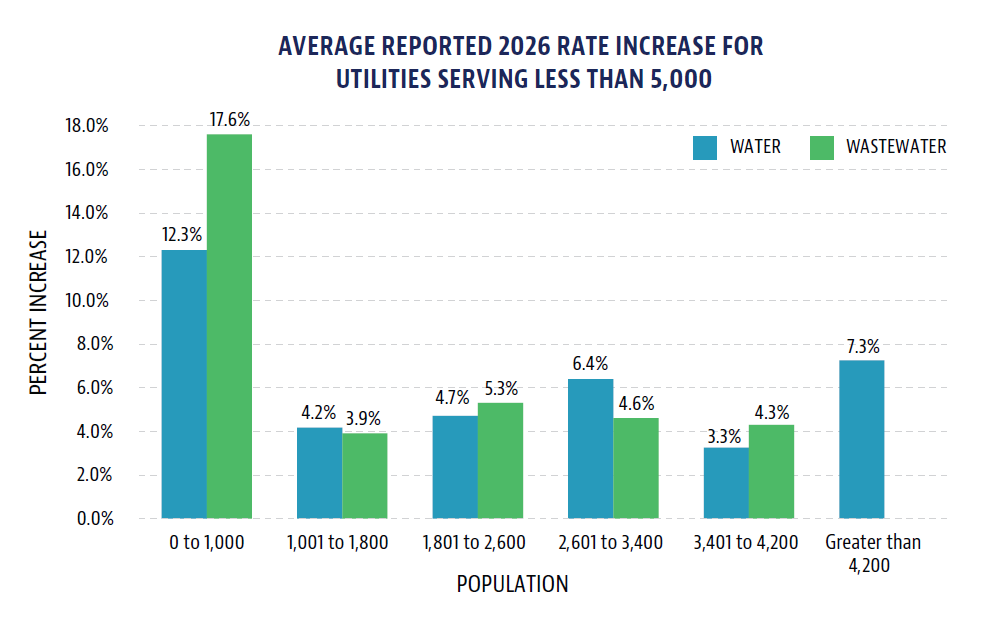
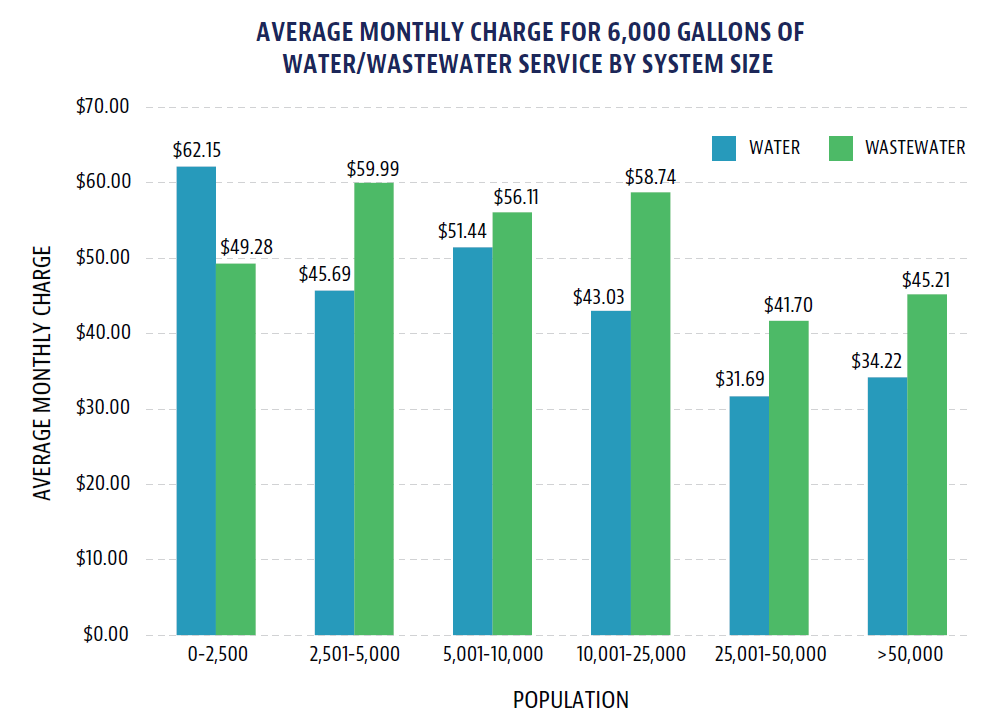
Figure 3 illustrates the 2026 average monthly water and wastewater charges by population grouping for all municipal survey respondents, based on an average monthly use of 6,000 gallons. Of the municipal respondents in 2026, 72% of 2024 respondents also participated in 2025. Overall, the average monthly water and wastewater bill for 6,000 gallons increased by 10.5% from 2025, while the median bill for 6,000 gallons increased by 9.3%.
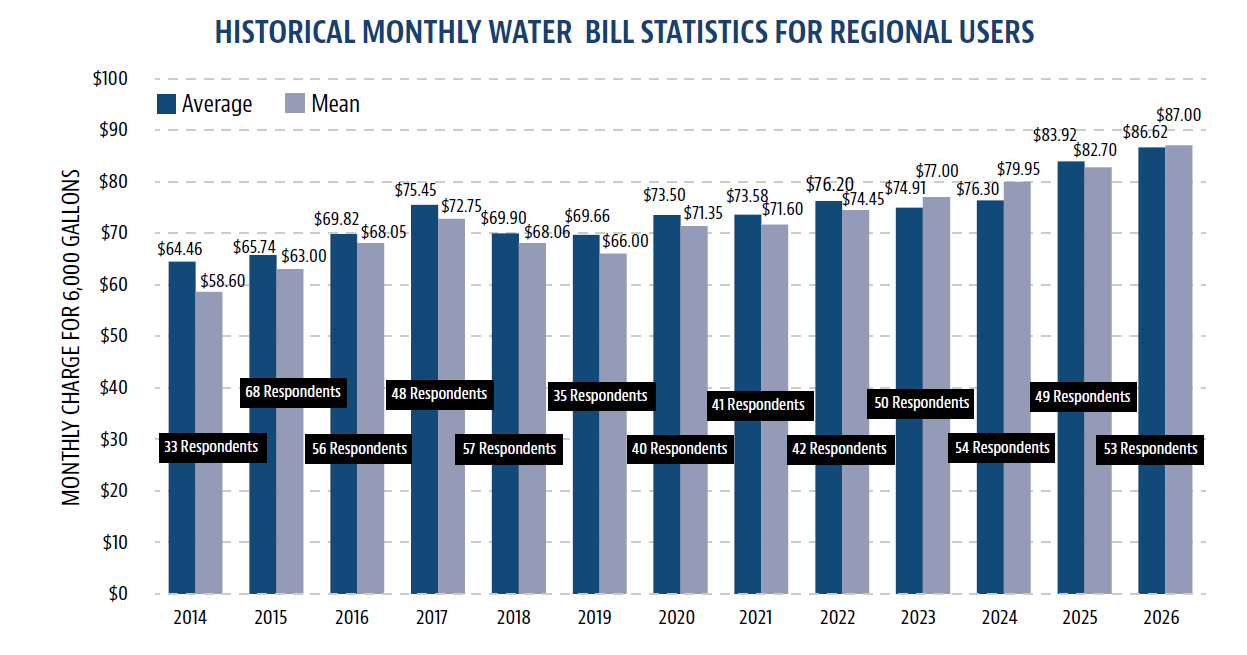
A summary of historical results reported by Regional Rural Water System rate survey participants since 2014 is provided in Figure 4, which shows the average and median reported charges for 6,000 gallons of water each year. The number of respondents to the survey each year is also indicated.
Water & Wastewater Charges Vs Inflation
Figures 5 and 6 illustrate how the average water and wastewater charge for 6,000 gallons climbed at a rate higher than historical inflation values, based on the CPI-U. Figure 5 illustrates the change in average charges for 6,000 gallons of water and wastewater service since 2002* for systems serving greater than 5,000 people. Figure 6 indicates similar information for systems serving less than 5,000 people since 2006*. The results illustrate the challenge that utility managers and policy makers continue to experience in meeting financial demands on system operations, while striving to minimize user charge increases.
*Note: The number of participants and geographical expanse of the annual rate survey has grown substantially since 2002 and 2006.